 FigureCheck
Repeated measurements: mean, range and standard deviation
Summarize repeated measurements using the mean and sample standard deviation, and understand what each statistic says.
Use the mean to estimate the centre of repeated measurements and sample standard deviation to describe their spread. Report the number of repeats and inspect the distribution rather than relying on one summary number.
What the mean and standard deviation answer
The arithmetic mean estimates a central value. Sample standard deviation measures typical spread around that mean and uses n minus 1 in its denominator. Neither statistic automatically identifies instrument bias, and both can be affected by outliers or a skewed distribution.
Show the measurements as well as the summary
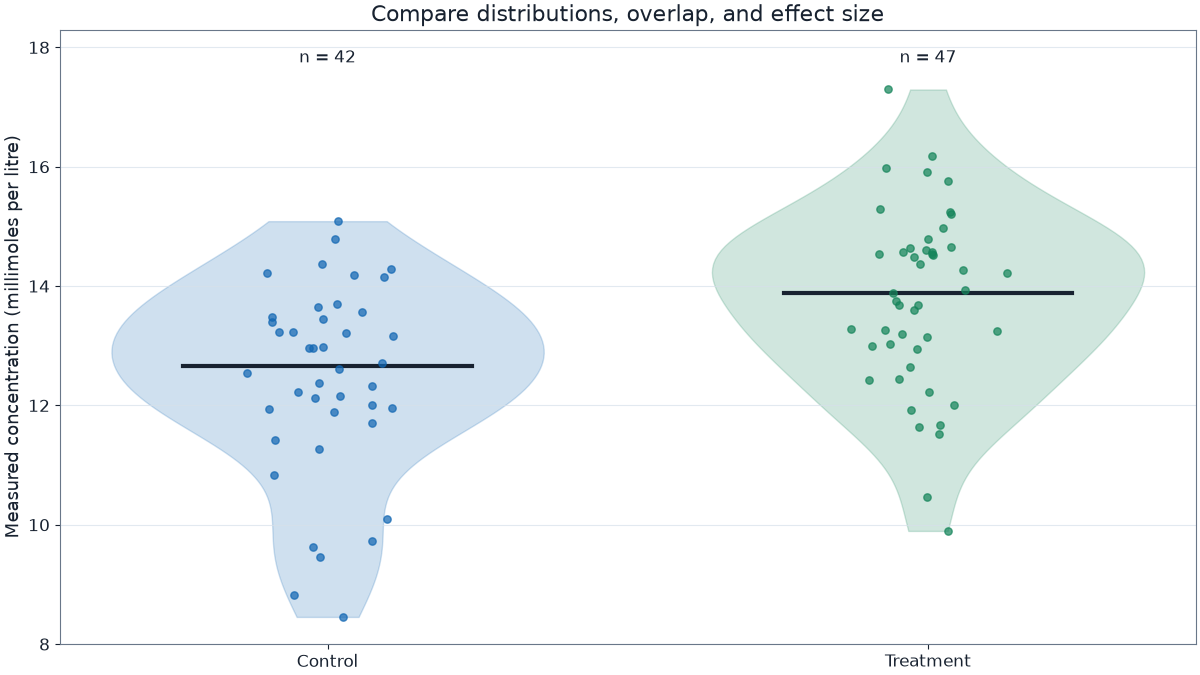
For small datasets, plot every point. For larger datasets, a distribution plot or transparent scatter can reveal clustering, gaps, and unusual observations hidden by a mean and error bar. Never delete an observation only because it changes the mean; investigate and document a scientific reason.
Worked example: five repeat times
For 2.1, 2.2, 2.0, 2.1, and 2.6 s, the mean is 2.20 s and the sample standard deviation is about 0.235 s. The 2.6 s value deserves inspection, but it should not be removed automatically. Record any procedural evidence before deciding how to treat it.
Common mistakes to avoid
- Reporting a mean without the number of repeats
- Confusing sample standard deviation with standard error
- Removing the highest and lowest values by default
Open an editable example and apply the idea to a real graph.
Sources and further reading
These links support the scientific principles summarized above. Always follow the reporting rules required by your course, laboratory, journal, or field.