 FigureCheck
Significant figures and uncertainty: how to report results
Report scientific measurements with sensible significant figures, decimal places, units, and uncertainty.
Round the uncertainty to one or two significant figures, then round the measured value to the same decimal place as the uncertainty. Preserve extra digits during calculations and round only the final result.
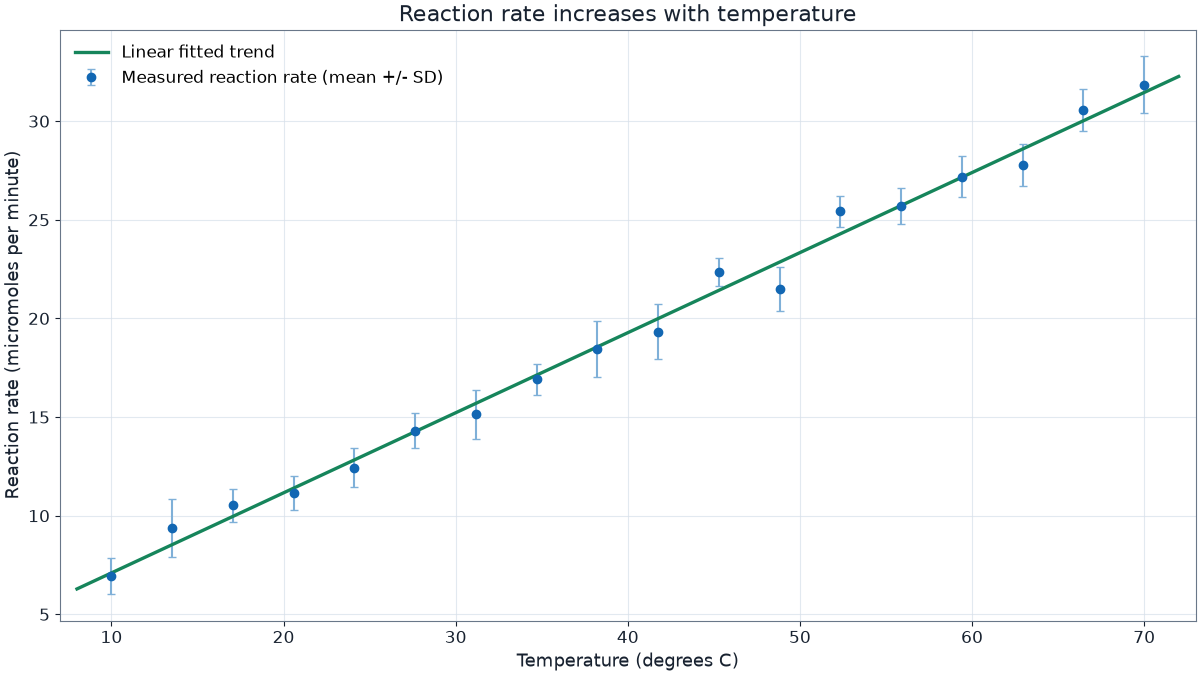
Match the value to its uncertainty
The uncertainty determines the meaningful final decimal place. If an uncertainty is 0.3 cm, reporting a value as 12.34781 cm implies unsupported precision. A consistent result is 12.3 plus or minus 0.3 cm. Two significant figures in the uncertainty can be useful when its leading digit is small or when a stated convention requires it.
Keep guard digits while calculating
Premature rounding can change a fitted gradient, propagated uncertainty, or final comparison. Store and calculate with additional digits, then format the reported result at the end. Significant figures communicate measurement resolution; they do not make uncertain data more accurate.
Worked example: rounding a fitted result
A calculation gives 9.82641 plus or minus 0.14682 m/s squared. Rounding the uncertainty to two significant figures gives 0.15 m/s squared, so round the value to the hundredths place: 9.83 plus or minus 0.15 m/s squared.
Common mistakes to avoid
- Rounding every intermediate calculation
- Matching significant figures but not decimal places
- Using extra displayed digits to imply higher-quality measurements
Open an editable example and apply the idea to a real graph.
Sources and further reading
These links support the scientific principles summarized above. Always follow the reporting rules required by your course, laboratory, journal, or field.