 FigureCheck
How to write a scientific figure caption
Write a self-contained scientific figure caption that identifies the result, variables, sample, uncertainty, and analysis.
A useful caption lets the figure stand on its own: state what is shown, identify groups and variables, define symbols and error bars, give sample size, and briefly name the analysis. Do not use the caption as a second discussion section.
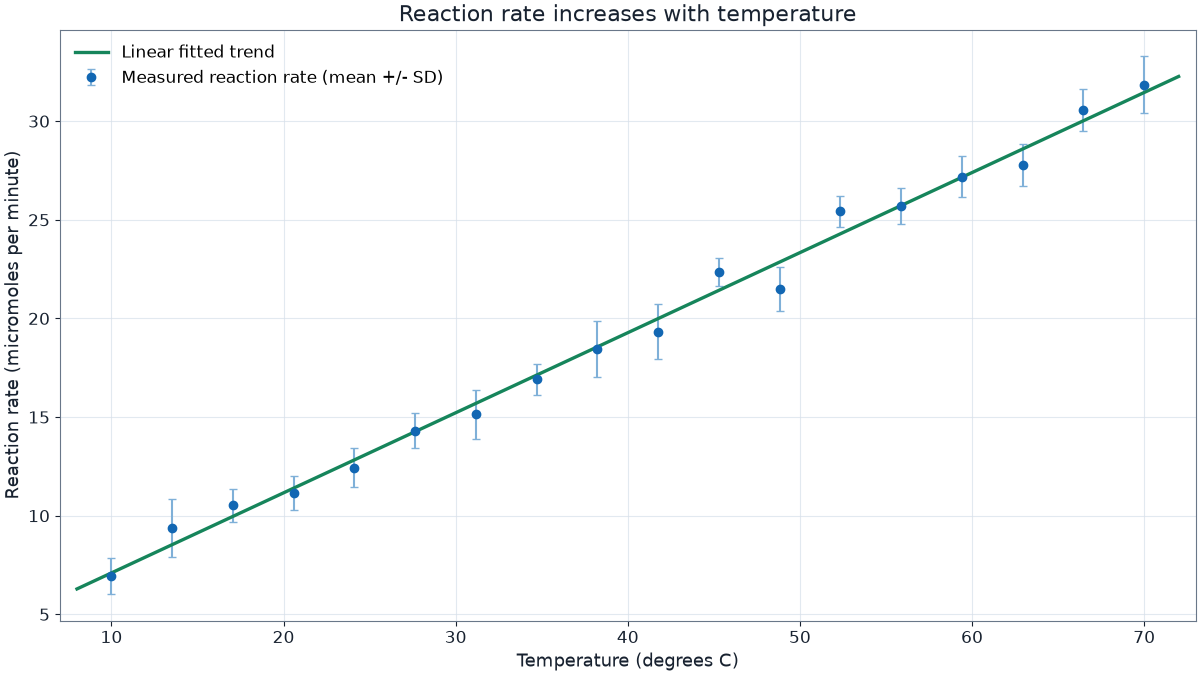
A practical caption structure
Start with a short finding-oriented title or opening sentence. Describe what each panel, marker, line, or color represents. Define abbreviations and state exactly what error bars or shaded bands mean. Add sample size and essential statistical details that are not already clear from the axes or legend.
Make the graphic and caption work together
Axes carry variable names and units; the legend distinguishes series; the caption supplies experimental and analytical context. Avoid duplicating all axis text in prose. Check that a reader can understand the figure without searching the main text for basic definitions.
Example caption
Figure 2. Temperature increased linearly with heating time. Points show three independent trials; bars show mean plus or minus one standard deviation (n = 3). The solid line is an ordinary least-squares fit over 0 to 300 s; the shaded band shows the fitted 95% confidence interval.
Common mistakes to avoid
- Writing only a title such as Results
- Failing to define error bars or shaded bands
- Claiming that a fitted line proves the proposed mechanism
Open an editable example and apply the idea to a real graph.
Sources and further reading
These links support the scientific principles summarized above. Always follow the reporting rules required by your course, laboratory, journal, or field.