 FigureCheck
How to write a scientific results section
Write a clear scientific results section that reports patterns, estimates, uncertainty, tests, and figures without overclaiming.
A results section states what was observed, quantifies the important pattern, points readers to the relevant figure or table, and reports uncertainty or statistical evidence. Interpretation belongs in the discussion unless the required format combines them.
Lead with the result, then support it
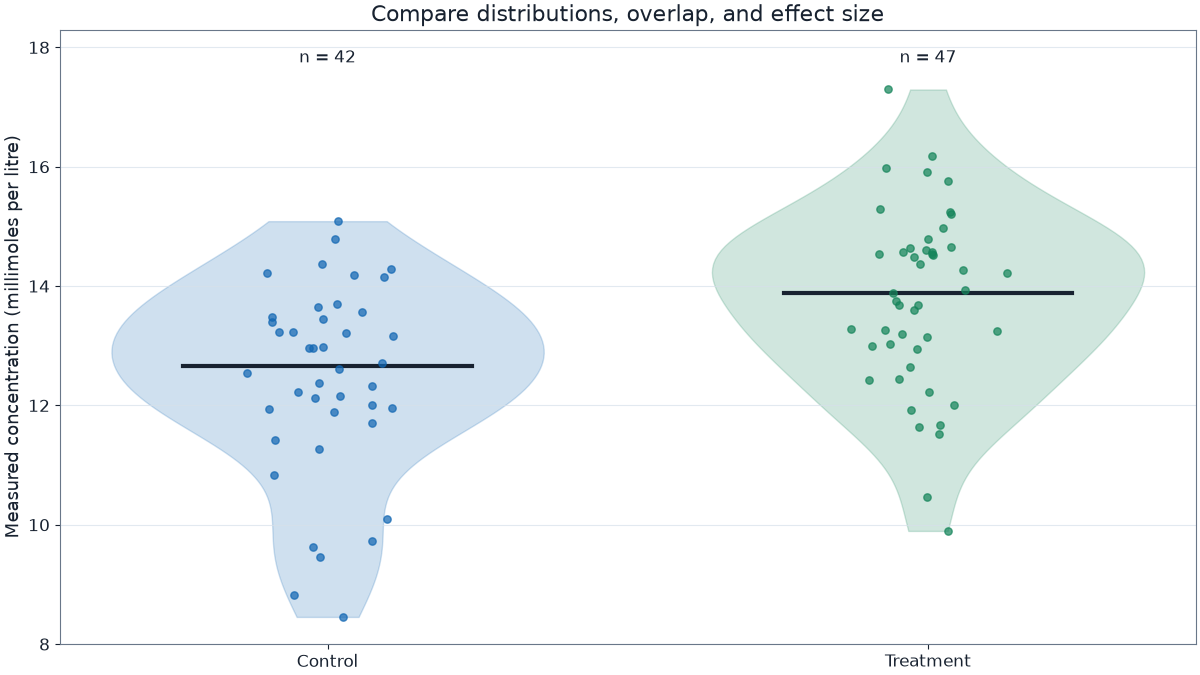
Begin a paragraph with the main observed pattern. Add the estimate, units, uncertainty or interval, sample size, and statistical comparison that support it. Refer to a figure by number and describe the finding rather than narrating every point. Report null and unexpected results as carefully as positive ones.
Keep the claim proportional to the design
A correlation does not by itself establish causation. A small p-value is not the size or importance of an effect. Name the test, estimate the effect, report uncertainty, and state any multiple-comparison correction or model assumptions that materially affect the reading.
Example result sentence
Mean growth was 2.4 cm greater in the treatment group than in the control group (95% CI 1.1 to 3.7 cm; n = 24 per group; Figure 2). This sentence states the direction, magnitude, uncertainty, sample size, and figure location without claiming a mechanism.
Common mistakes to avoid
- Repeating every value already visible in a table
- Using significant as a synonym for large or important
- Introducing new methods or unsupported causal explanations
Open an editable example and apply the idea to a real graph.
Sources and further reading
These links support the scientific principles summarized above. Always follow the reporting rules required by your course, laboratory, journal, or field.