 FigureCheck
Independent, dependent and control variables
Identify independent, dependent, controlled, and confounding variables, then map them correctly onto a scientific graph.
The independent variable is deliberately changed or used as the predictor; the dependent variable is measured as the response. Control variables are held consistent, while confounders vary with the predictor and can create an alternative explanation.
Map the experiment before plotting
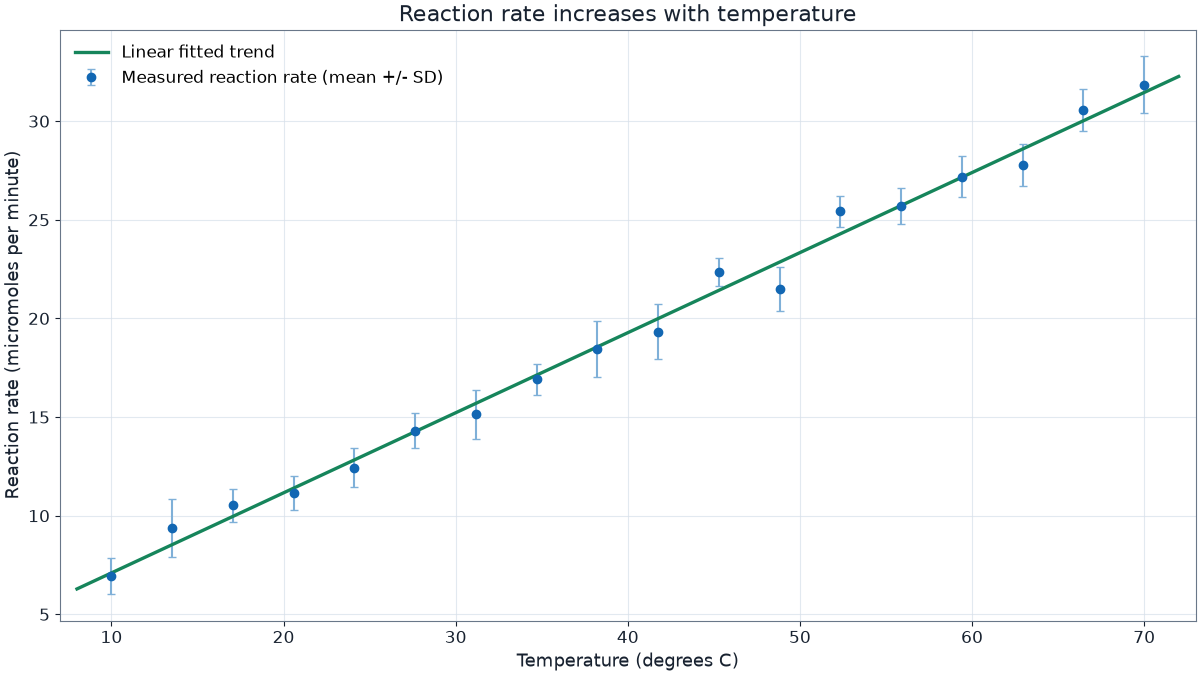
In a controlled experiment, place the independent variable on the x-axis and the dependent variable on the y-axis. Record controls and conditions in the method, even when they do not appear on the graph. In observational work, predictor and response are often more honest terms because the study may not establish causation.
Groups, repeats and confounders
A categorical treatment can define separate series or x-axis groups. Biological or technical repeats should remain identifiable. A variable is not controlled merely because it was measured; design or analysis must prevent it from explaining the apparent relationship.
Worked example: light and photosynthesis
If light intensity is changed and oxygen production is measured, intensity is the independent variable and oxygen production is the dependent variable. Temperature, plant species, exposure time, and carbon dioxide availability may need control. A temperature drift correlated with lamp intensity is a possible confounder.
Common mistakes to avoid
- Calling every x-axis variable independent in an observational study
- Treating a control group as the same thing as a controlled variable
- Changing several conditions together and attributing the result to one
Open an editable example and apply the idea to a real graph.
Sources and further reading
These links support the scientific principles summarized above. Always follow the reporting rules required by your course, laboratory, journal, or field.