 FigureCheck
Choosing a fit
Choose a curve fit and detect overfitting
Match the model to the scientific question, then use residuals and validation evidence to distinguish useful structure from an unnecessarily flexible curve.
Hands-on example
Try this in FigureCheck
Compare linear, polynomial, and other models on the same curved data without judging by R squared alone.
Opens a small synthetic dataset with a step-by-step guide in a new editable session.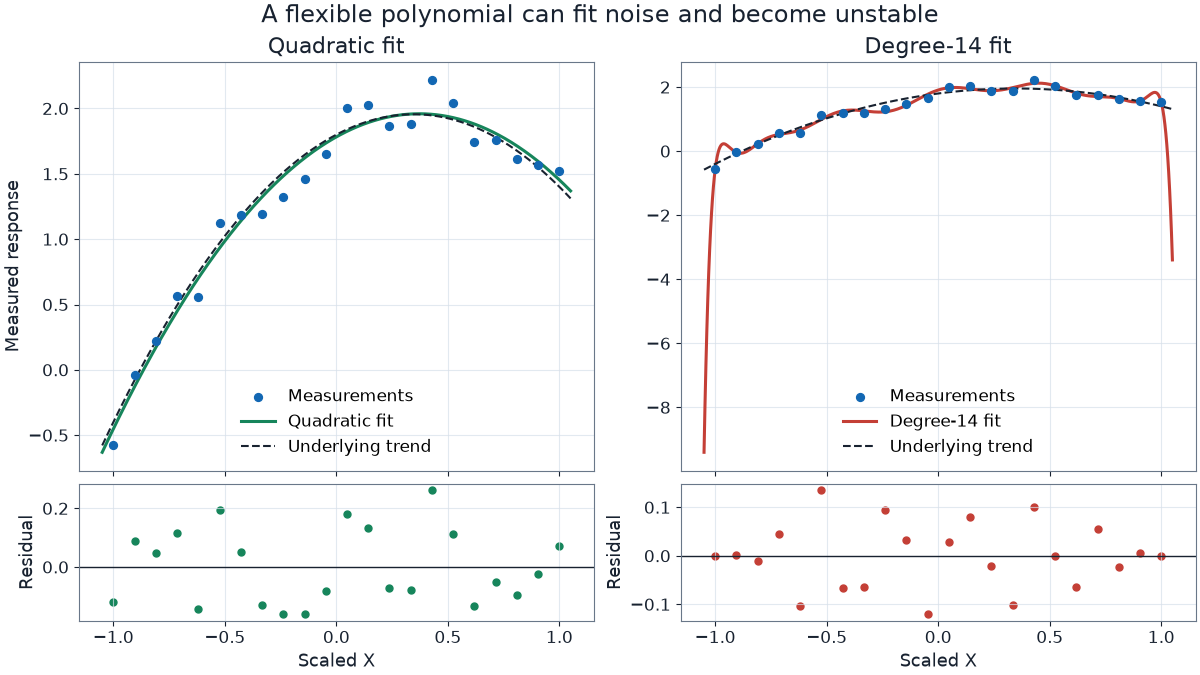
Choose from the mechanism, not only the score
- Linear models a constant rate of change.
- Polynomial models curvature but high degrees can oscillate between observations.
- Exponential models a response proportional to its current value.
- Sine and Fourier models repeatable periodic structure when the sampling covers the cycle adequately.
Look beyond training fit
An overfit model can have very small error on the observations used to create it and much larger error on held-out observations. FigureCheck's ML signal combines validation behavior with curve-shape evidence, but its probability remains diagnostic guidance rather than proof.
Underfitting is different: both training and validation errors remain high because the selected model is too simple to capture important structure.
Inspect residuals and stability
A useful fit normally leaves residuals without a strong pattern. Repeating curves, changing variance, isolated extremes, or large changes after removing one point deserve investigation.
A higher degree is not automatically a better scientific model. Prefer the simplest model that is plausible, stable, and supported by validation evidence.