 FigureCheck
Fourier fitting
Fourier curve fitting for periodic and repeating data
Use Fourier series to model repeating scientific signals, choose the number of terms carefully, and distinguish a genuine period from a flexible fit to noise.
Hands-on example
Try this in FigureCheck
Fit a repeating signal with one Fourier term, then add terms only when residual and validation evidence support them.
Opens a small synthetic dataset with a step-by-step guide in a new editable session.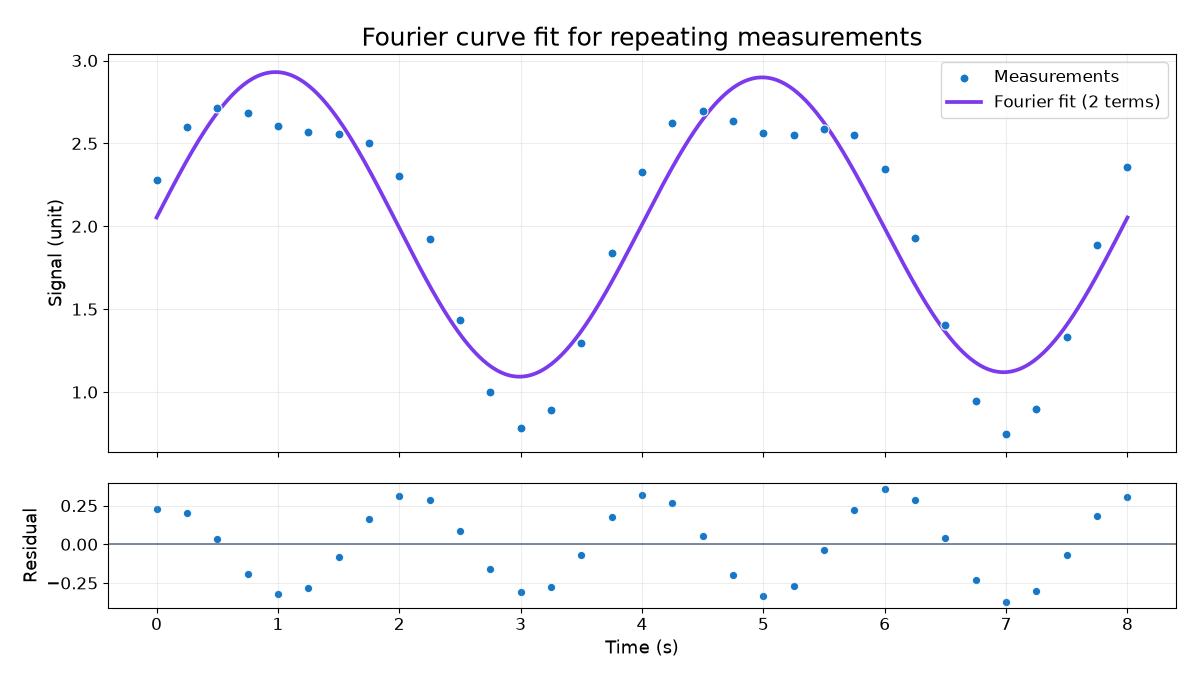
What does a Fourier fit do?
A Fourier series combines sine and cosine waves. The first term captures a broad repeating cycle, while later harmonics can represent sharper or more complicated periodic shapes. FigureCheck fits the coefficients to the selected data over the observed X span.
When is Fourier fitting appropriate?
- Use it when the process genuinely repeats, such as rotation, vibration, seasonal behavior, or a periodic signal.
- Cover enough cycles to distinguish repetition from one isolated rise and fall.
- Check whether sampling times and missing observations could distort the apparent frequency.
- Avoid it for a one-time trend merely because a many-term Fourier curve can follow the points.
How many Fourier terms should you use?
Start with one term. Add terms only when they remove stable residual structure and improve validation performance. If training RMSE keeps falling while validation RMSE rises, the extra harmonics are fitting noise rather than repeatable signal.
High-frequency wiggles between measurements, sensitivity to one observation, and unstable predictions are warning signs. Compare the result with the residual plot guide and FigureCheck's fit-check history.
Report the periodic model clearly
Report the fitted span, number of terms, implied fundamental period, sampling interval, and validation method. Use Copy fitted function to obtain the high-precision sine and cosine expression, including the actual pi symbols used in the model.