 FigureCheck
IB Physics uncertainty
IB Physics guide to uncertainty and max-min gradients
Present uncertainty, error bars, maximum and minimum gradients, and a concise worked result suitable for an IB Physics scientific investigation.
Hands-on example
Try this in FigureCheck
Use the example error bars to rehearse an auditable IB-style max-min gradient calculation.
Opens a small synthetic dataset with a step-by-step guide in a new editable session.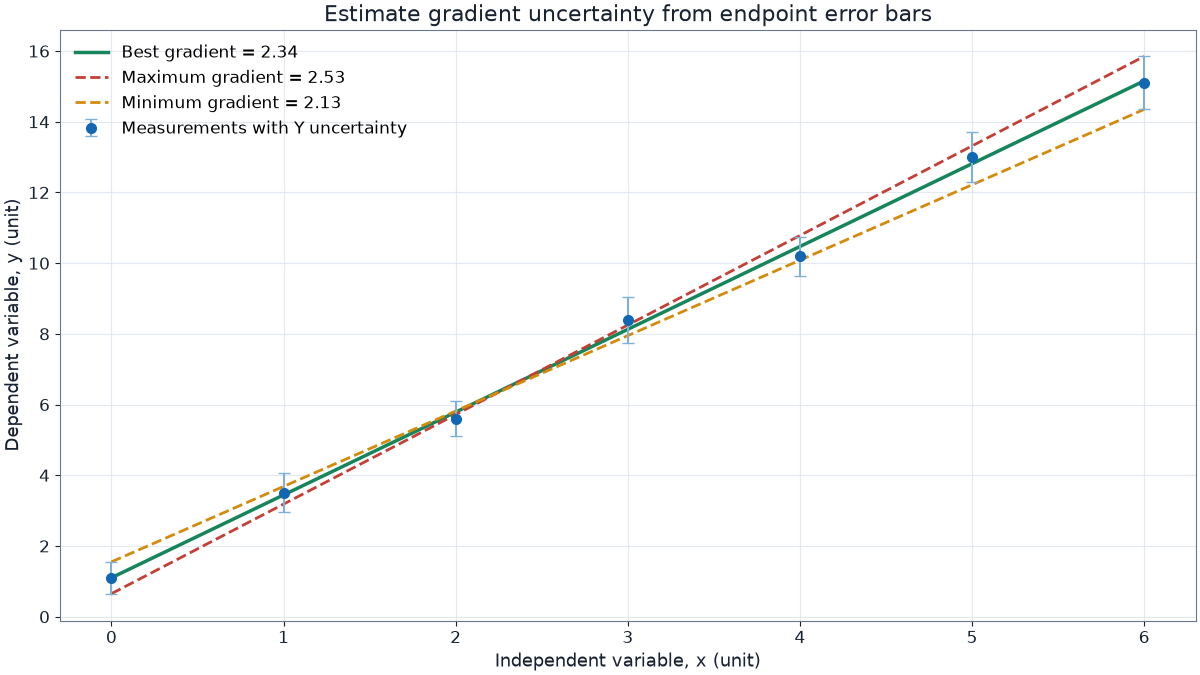
Why this method appears in IB Physics
IB describes data analysis and the limitations of scientific methods as core parts of Diploma Programme Physics. An official Physics markscheme also demonstrates a maximum-gradient line drawn through opposite error-bar extremes. This guide turns that graphical method into a repeatable calculation.
IB Diploma Programme Physics · Official IB Physics markscheme example
What your graph should communicate
- Put the independent variable on X and the dependent variable on Y, with quantity and unit in each axis label.
- Include justified uncertainty for measured quantities and explain whether it comes from resolution, repeated trials, or another source.
- Plot error bars when they are meaningful and visible. Explain any bars that are smaller than the plotted marker.
- Use a line of best fit supported by the expected relationship; do not connect measurements point to point unless their sequence is meaningful.
IB-style max-min gradient working
- Calculate the best gradient using two well-separated points on the fitted line, not necessarily two raw data points.
- For the maximum gradient, use a line from the lower end of the left endpoint error bar to the upper end of the right endpoint error bar.
- For the minimum gradient, reverse those error-bar extremes.
- Calculate Δm = (mmax - mmin) / 2.
- Report the result as m = mbest ± Δm, including units.
FigureCheck performs these endpoint calculations from the selected symmetric Y-error column. Keep one worked substitution in your report so the method is auditable.
Write the interpretation, not only the arithmetic
Explain whether the gradient range supports the expected value or model, identify the dominant sources of uncertainty, and distinguish random spread from systematic limitations. Discuss how a realistic improvement would reduce the important uncertainty.
Course guidance and teacher instructions take priority. FigureCheck supports the analysis; it does not award marks or guarantee that a particular presentation satisfies an assessment criterion.