 FigureCheck
Uncertainty calculations
Calculate measurement and gradient uncertainty
Choose an uncertainty that matches the measurement process, propagate it through calculations, and estimate gradient bounds from error bars without overstating precision.
Hands-on example
Try this in FigureCheck
Inspect the best, maximum, and minimum gradients calculated from the example Y uncertainties.
Opens a small synthetic dataset with a step-by-step guide in a new editable session.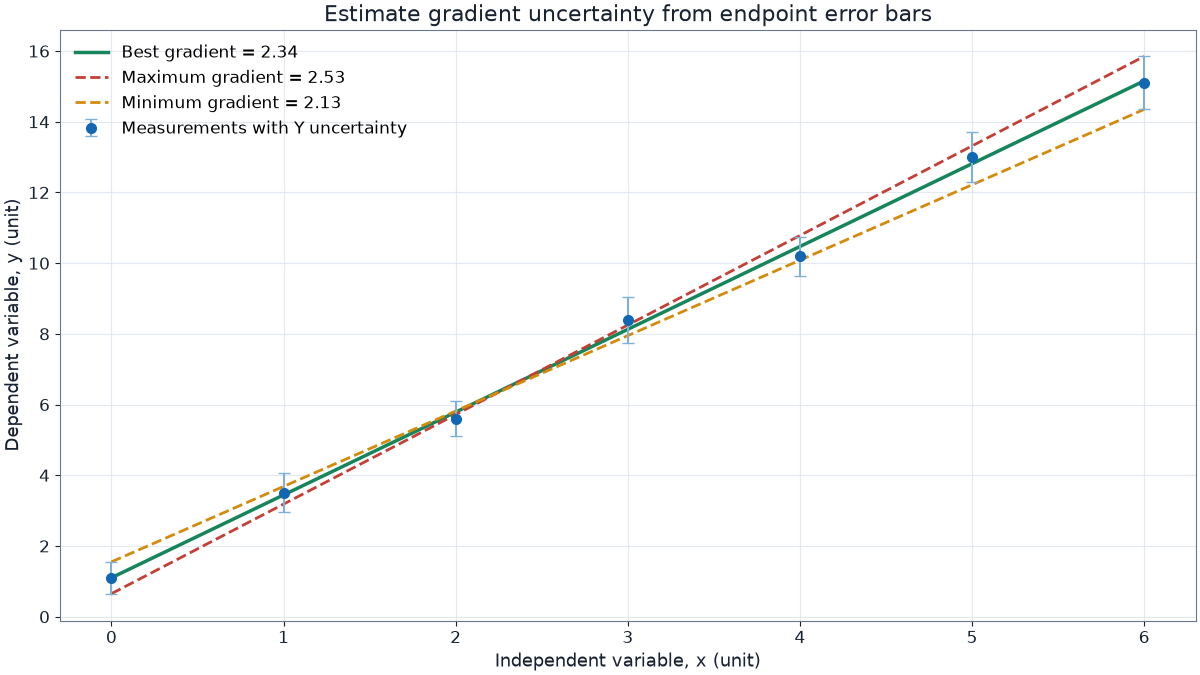
Start with what the uncertainty represents
- Instrument resolution limits how finely a device can be read. A justified reading uncertainty may be based on the smallest division, display resolution, or manufacturer specification.
- Repeated measurements show random variation. Standard deviation describes their spread; uncertainty in a mean answers a different question.
- A fitted parameter uncertainty describes uncertainty from a model and its assumptions. It is not automatically the same as measurement uncertainty.
State the source and meaning of every uncertainty. Do not choose an uncertainty solely because it produces attractive error bars.
Propagate uncertainty through a calculation
- For a conservative sum or difference, add the absolute uncertainties.
- For a conservative product or quotient, add relative or percentage uncertainties.
- For a power, multiply the relative uncertainty by the absolute value of the power.
- Root-sum-square propagation can be appropriate for independent random uncertainties, but only when its assumptions match the experiment.
Keep extra digits during calculation. Round the uncertainty sensibly at the end, then round the measured value to the same decimal place.
Calculate maximum and minimum gradients
For symmetric Y error bars, FigureCheck uses the points at the smallest and largest X values. The steepest line joins the lower edge of the left error bar to the upper edge of the right error bar. The shallowest line uses the opposite edges.
Gradient uncertainty: Δm = (mmax - mmin) / 2
Percentage uncertainty: 100 × Δm / |mbest|
This endpoint method includes symmetric Y uncertainty only. If X has uncertainty, or Y has been transformed or calculated, propagate those uncertainties first or use a method designed for errors in both axes.
Use the result in FigureCheck
- Select X, Y, and the matching Y-error column in Data.
- Open Stats and choose the visible series to inspect.
- Enable Show maximum and minimum gradient lines on graph to display the two limiting lines.
- Read the best, minimum, and maximum gradients and the calculated uncertainty.
- Export stat data to preserve the method note and numerical result.