 FigureCheck
Outliers and data cleaning
Review and remove outliers responsibly
Identify unusual observations relative to a stated baseline, inspect them individually, and preserve a defensible record of any exclusion.
Hands-on example
Try this in FigureCheck
Inspect the unusual point relative to a quadratic baseline, highlight it, and decide whether removal is defensible.
Opens a small synthetic dataset with a step-by-step guide in a new editable session.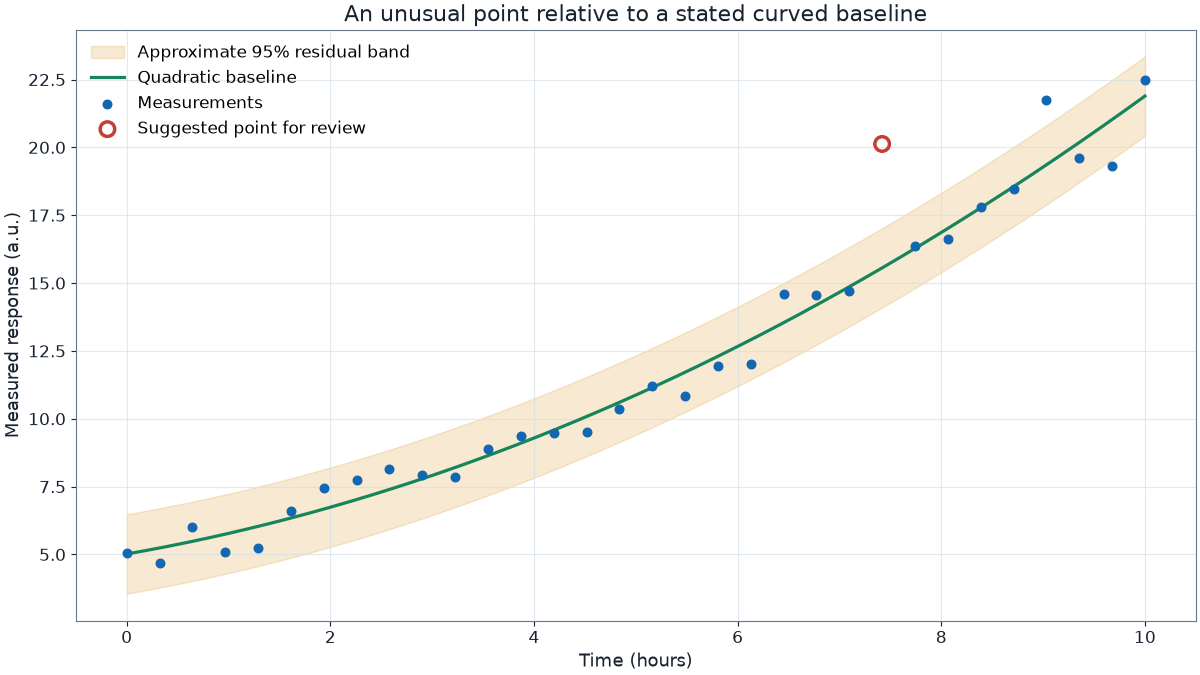
An outlier is relative to a model
For X-Y data, an unusual point is often defined by its residual from a trend rather than by its Y value alone. A point can be extreme relative to a linear model and reasonable relative to a curved model.
Because the same observations are used to estimate the baseline, an extreme point can pull the fitted curve toward itself. Compare plausible baselines and inspect influential points rather than treating one automatic label as final.
Use FigureCheck's selection workflow
- Choose the series and baseline in Stats.
- Highlight suggested points and select a marker to inspect its row values.
- Check only the observations you intend to remove.
- Remove them from the working copy and compare the revised result with the original.
Reasons that can justify exclusion
Examples include a documented instrument failure, impossible transcription, failed quality-control criterion established before analysis, or a measurement outside the method's valid range. Disagreement with the hypothesis is not a sufficient reason.
Keep the original measurements. Report the rule, affected rows, and analysis with and without exclusions when the decision could change the conclusion.