 FigureCheck
Fit interpretation
How to interpret R-squared and Pearson correlation
Use R-squared and Pearson correlation as limited summaries, not as proof that a model is correct or that one variable causes another.
Hands-on example
Try this in FigureCheck
Fit curved data and compare R squared, Pearson correlation, the plotted shape, and residual evidence.
Opens a small synthetic dataset with a step-by-step guide in a new editable session.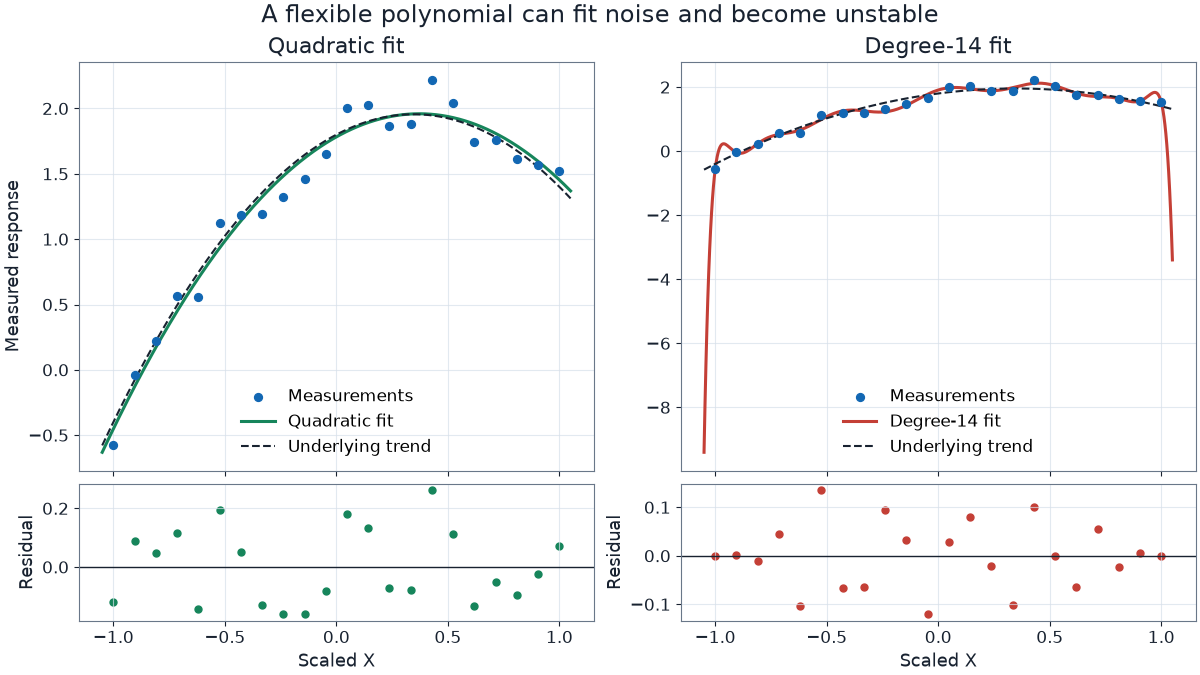
What R-squared summarizes
R-squared compares the fitted residual variation with the variation around the mean in the selected data. Values closer to one indicate that the fitted predictions account for more of that sample variation. The number does not show whether the model form is scientifically justified, whether errors are independent, or whether predictions generalize.
What Pearson r summarizes
Pearson correlation measures the direction and strength of a linear association. It is sensitive to outliers and can be near zero for a strong curved relationship. Correlation is symmetric: swapping X and Y does not change r, even though a predictive model may change.
Read the graph and residuals together
- Inspect whether residuals show curves, changing spread, or clusters.
- Compare simpler and more complex models on validation data.
- Report uncertainty and the domain over which the fit was evaluated.
- Never interpret association alone as causation.
Continue with how to read a residual plot and how to choose model complexity.