 FigureCheck
Uncertainty and spread
Standard deviation vs standard error on a graph
Distinguish variation among observations from uncertainty in an estimated mean before choosing error bars or shaded bands.
Hands-on example
Try this in FigureCheck
Inspect measured uncertainty and residual spread while distinguishing both from uncertainty in a sample mean.
Opens a small synthetic dataset with a step-by-step guide in a new editable session.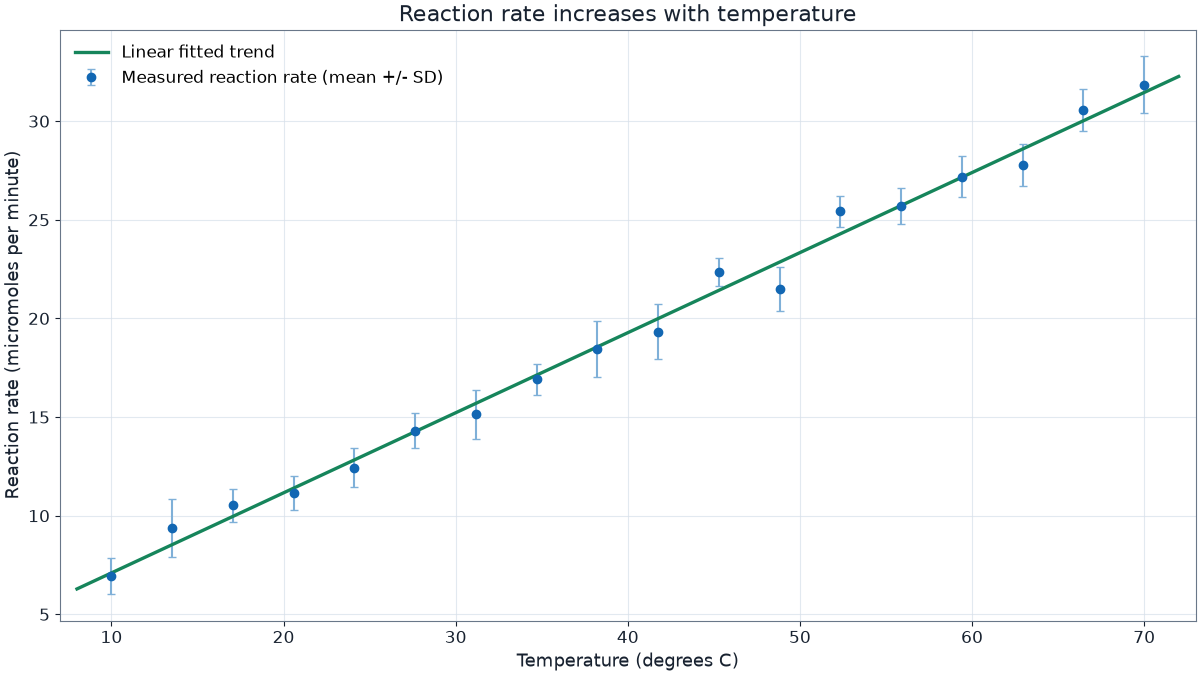
Standard deviation describes spread
Sample standard deviation summarizes how far observations typically vary around their sample mean. It describes the observed distribution, not the precision of one instrument reading and not automatically the uncertainty of every plotted point.
Standard error describes an estimate
The standard error of the mean estimates how precisely the sample mean represents the population mean under the sampling assumptions. For independent observations it is commonly calculated as SD divided by the square root of the sample size. It becomes narrower as the sample size grows, even when the underlying variation is unchanged.
A confidence interval is generally more interpretable than showing plus or minus one SEM, but its calculation depends on the design and distributional assumptions.
Label the uncertainty honestly
- State SD, SEM, confidence interval, or measurement uncertainty explicitly.
- Report the sample size and whether observations are independent.
- Do not use SEM to make variable data look artificially consistent.
- For individual measurements, use the uncertainty assigned to each measurement rather than a group SEM.
See measurement and gradient uncertainty for propagation and max-min gradient methods.