 FigureCheck
Logarithmic axes
Use logarithmic axes without misleading readers
Use a log scale when ratios and orders of magnitude matter, and make the transformed visual interpretation explicit.
Hands-on example
Try this in FigureCheck
Switch the example Signal axis between linear and logarithmic scales and compare what each view emphasizes.
Opens a small synthetic dataset with a step-by-step guide in a new editable session.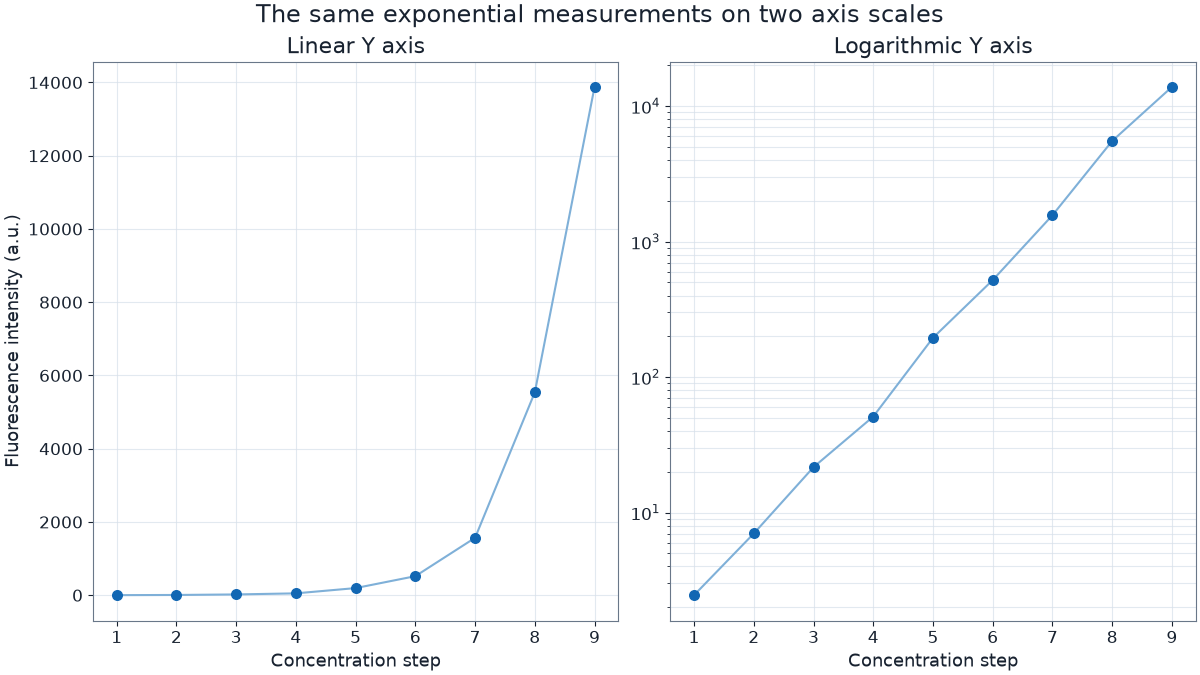
What changes on a log axis
Equal distances represent equal ratios rather than equal differences. On a base-10 logarithmic axis, moving from 1 to 10 occupies the same distance as moving from 10 to 100.
Log axes are useful for exponential relationships, multiplicative processes, and measurements spanning several orders of magnitude.
Check the data first
- A standard logarithmic axis cannot display zero or negative values.
- Do not delete zero values silently to make a log plot work.
- State the log base or use tick labels that visibly show the original values.
- Fit interpretation depends on whether the axis is transformed or the underlying values are transformed.
Linear and logarithmic views answer different questions
The same measurements can look compressed on a linear axis and well separated on a logarithmic axis. Select the scale from the scientific mechanism and intended comparison, not from whichever version looks more dramatic.