 FigureCheck
Residual plots
How to read a residual plot for curve fitting
Use residual patterns to identify bias, missing curvature, changing variance, and individual observations that a fit score can hide.
Hands-on example
Try this in FigureCheck
Show residuals for a quadratic fit and look for curvature, changing spread, and unusual deviations.
Opens a small synthetic dataset with a step-by-step guide in a new editable session.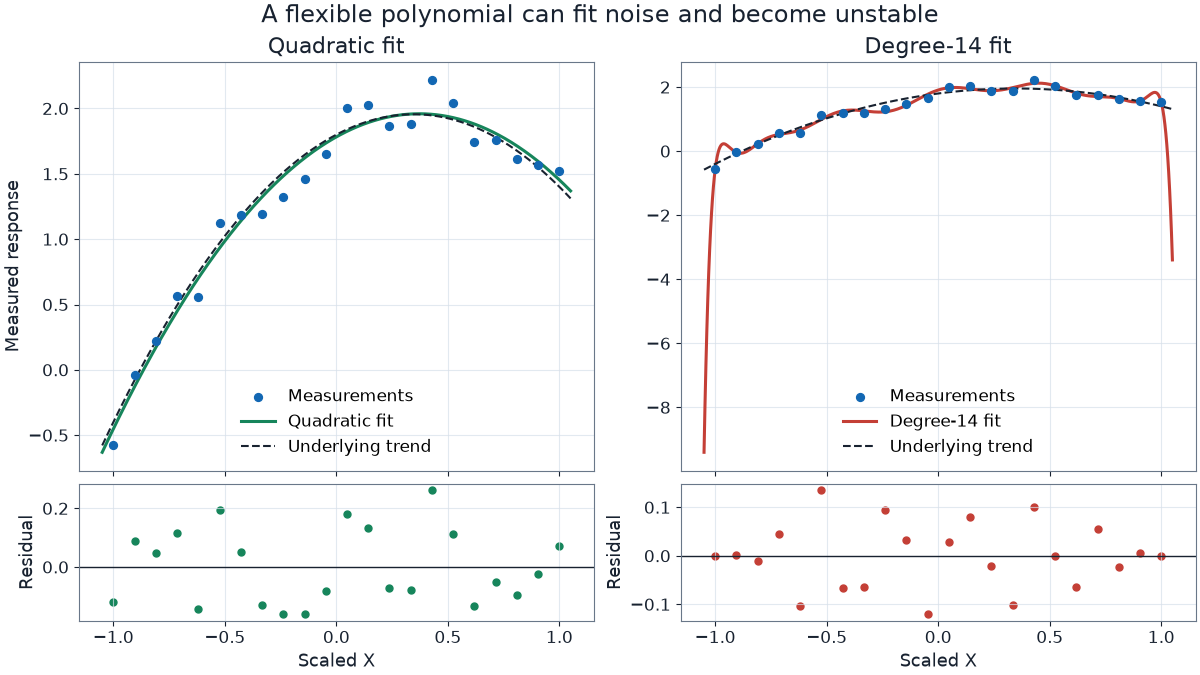
Residuals are observed minus predicted
A positive residual means the observation lies above the fitted value; a negative residual lies below it. The vertical zero line is therefore the model prediction. Residual size has the same Y unit as the plotted response unless it has been standardized.
Patterns that deserve attention
- A broad curve suggests that the model missed systematic curvature.
- A funnel shape suggests that residual variation changes across X.
- Long runs above or below zero can indicate time dependence or group structure.
- One distant residual may be an unusual observation, but its meaning depends on the fitted baseline.
A random-looking plot is not sufficient proof
Residual plots help falsify inadequate models, but they cannot prove a model is true. Check the experimental mechanism, sample size, uncertainty, validation behavior, and plausible alternatives. A very flexible model can force training residuals near zero while predicting new observations poorly.
Use responsible outlier review and R-squared interpretation alongside the residual plot.