 FigureCheck
Comparing two groups
Compare two independent groups statistically
Compare two visible series with a test that matches the study design, then report the effect size and uncertainty alongside the p-value.
Hands-on example
Try this in FigureCheck
Run the available independent-group tests on Control and Treatment, then interpret effect size with the p-values.
Opens a small synthetic dataset with a step-by-step guide in a new editable session.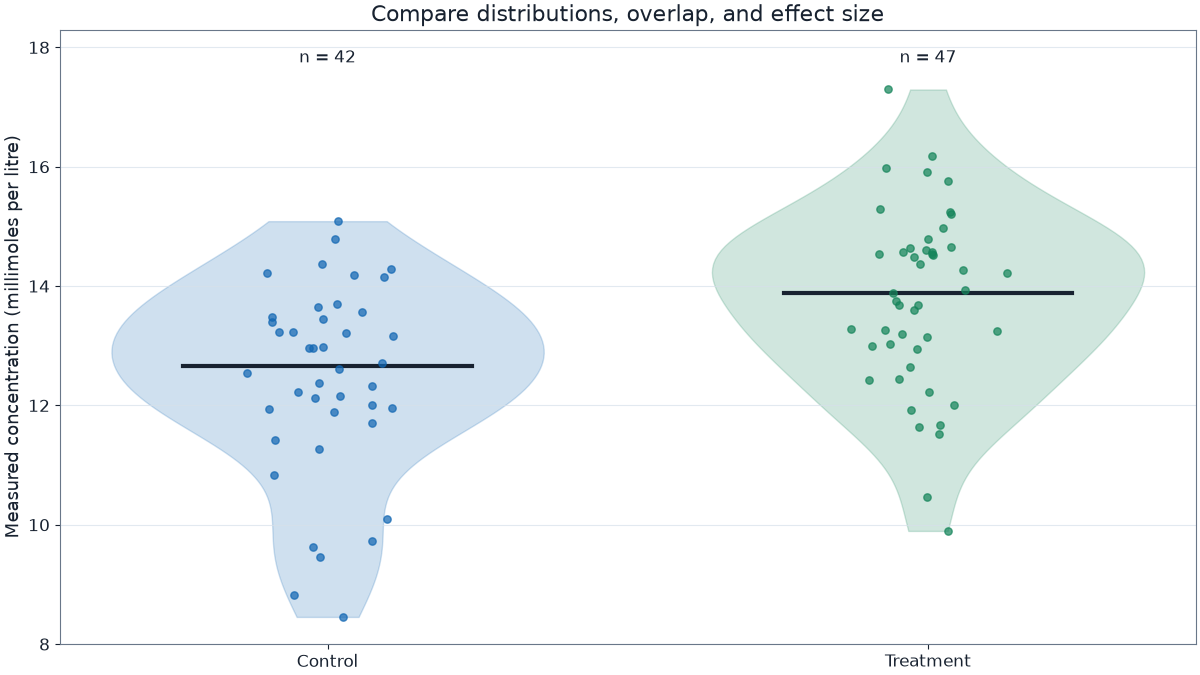
Start with the study design
Use an independent comparison when observations in Series A are not deliberately matched to observations in Series B. Use a paired method only when each point has a meaningful partner, such as before-and-after measurements from the same subject.
What the common tests ask
- Welch's t-test assesses a difference in means without assuming equal variances.
- Mann-Whitney U assesses whether values in one independent group tend to rank higher than values in the other.
- Kolmogorov-Smirnov detects broader differences between two continuous distributions, including shape and spread.
- Effect sizes describe the magnitude and direction of the observed difference.
A p-value is not the result by itself
Interpret the sample size, overlap, effect size, uncertainty, and measurement process together. When many variables are tested, use a multiple-comparison correction such as Benjamini-Hochberg and distinguish planned tests from exploratory ones.
A small p-value can accompany a scientifically tiny effect, while an important effect can remain uncertain in a small sample.